


Is the picture getting any clearer?
Topic: Corporate parenting, Foster care, Kinship care, Local authority, Looked after at home, Residential care
Author: Micky Anderson

The recently released Children’s Social Work Statistics for Scotland includes data about children in care and data on care leavers. In this post for the CELCIS blog I’ll be focusing solely on the information about children in care. We’ll be taking a close look at the data about the experiences of care leavers in our next blog post.
The latest data provides us with an opportunity to consider what it can tell us about progress against some of the indicators included in the Promise Progress Framework, but first it’s important to acknowledge that the addition of postcode data to the statistics gives us new and useful information to helping us to further understand the circumstances families are navigating.
In his recent blog post about the latest child protection statistics, my colleague Dr Alex McTier welcomed the inclusion of deprivation data and, for the first time, similar data is provided in the Looked after Children statistics. The Scottish Index of Multiple Deprivation ranks neighbourhood areas in Scotland from least to most deprived, so we can now see the extent of deprivation of the neighbourhoods that children were living in by using their home postcode before they went into care. The intention is to look at the relationship between the extent of deprivation of areas and children being in care, with much work already done linking levels of deprivation to children and their families’ contact with children’s care and protection services. These Scottish statistics show that the ‘social gradient’ observed by Professor Paul Bywaters and colleagues could hardly be clearer (Chart 1).
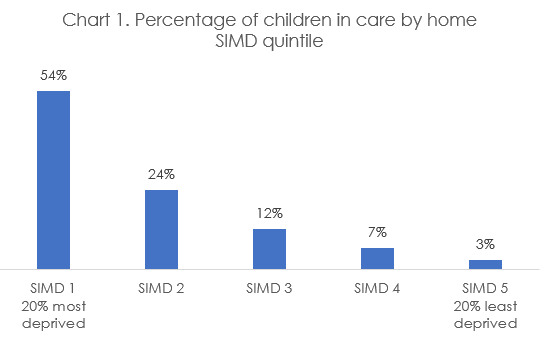
Over half (54%) of children in care had lived in areas amongst the 20% most deprived in Scotland, with just 3% of children in care coming from the least deprived areas. It is essential that this relationship is not just seen, but is understood. If we are to help families, reduce risk, harm and the pressures faced, the intersectionality between the circumstances in which children live can’t be ignored.
The headline that immediately grabs our attention is the continuing fall in the number of children in care, which dipped below 12,000 in 2024 (Chart 2). It’s completely understandable that a reduction over time will generally be viewed positively, but we should also remember that a reduction in the number of children in care is only good news if the needs of children and families are being met outside the care system, and the raw numbers can’t answer this.
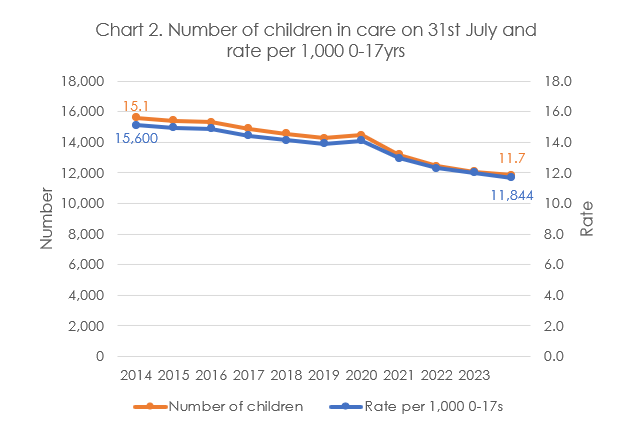
This chart shows the number and the rate of children in care per 1,000 children under 18 over time. Because this rate factors in population change, it tells us that the change isn’t simply because the number of children under 18 has decreased.
The Promise Progress Framework takes 2020 as a base year for comparison, and it would be tempting to claim that the 18% reduction of children in care from 2020 to 2024 is solid evidence of the impact of The Promise. Forgive me for repeating a couple of cautions about this interpretation: Note that there was already a downward trajectory before 2020, and that 2020 bucked the trend of the observed year-on-year decrease across this period. The increase in 2020 was largely due to the reduction in children leaving care because of disruption caused by the COVID-19 pandemic.
The number of children going into care during the year should be a more responsive and informative indicator than the number of children in care on a particular single date in July each year. This may help to tell us more about the impact of any changes to policy and practice might be having and if these are effective in supporting families and preventing children going into care. Reducing the number of children coming into care is part of the first outcome of the Promise Progress Framework.
Again, the impact of the COVID-19 pandemic is evident in the data for this indicator but, before we look at this, it’s important to be aware of a technical point that affects interpretation of this data. During the annual data submission process, local authorities are also given the opportunity to revise data submitted the previous year to include children going into and leaving care that were incorrectly omitted. This reconciliation process ultimately results in more complete and reliable data, but it does mean that there is a time lag of a year until this more complete data is available. The annual reports show a change from the previous year, reinforcing our natural tendency to determine if the direction of travel is up or down, but this may change when the revised data becomes available.
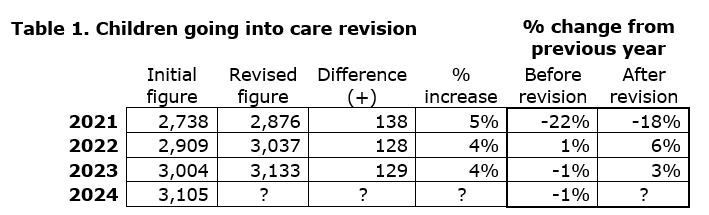
Table 1 shows the extent of revision for children coming into care in recent years. Each year revision led to around 130 children being added to the initial figure, so the reported 1% increase from 2021 to 2022 changed to 6%, and the reported 1% reduction from 2022 to 2023 changed to a 3% increase. The latest 2024 figure of 3,105 is also likely to be revised in the next annual statistical release, which means that we shouldn’t attempt to read too much into the comparatively small change that we observe at this stage. The apparent 1% reduction from 2023 to 2024 (3,133 to 3,105) could well disappear or indeed be reversed when the data is revised next year.
Chart 3 shows population rates for children coming into care since 2013, and we can see the largely downward trend for children entering care before 2020, the year in which The Promise was published and the COVID-19 pandemic struck. A linear (dotted) trend line extends the downward trend we can see during this period to show how more recent years would look if that same trend had continued and what we can see is that the latest figure for 2024 is still below this line, though it may change after this year’s data has been revised.
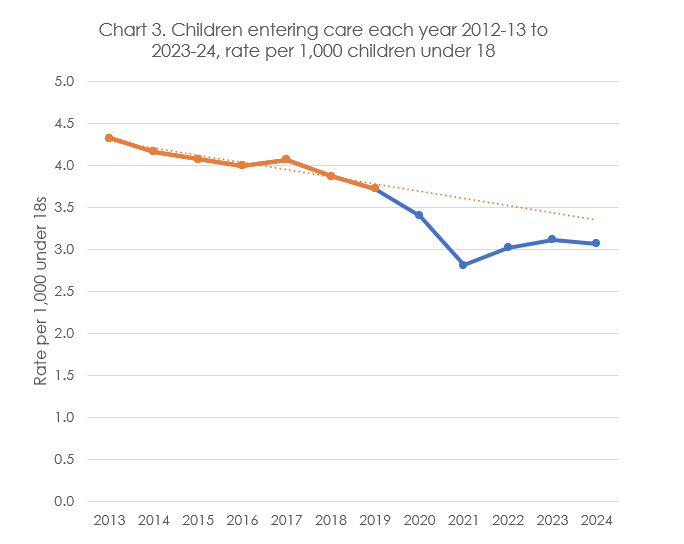
The impact of the COVID-19 pandemic contributed to the drop in 2020 and the even sharper fall in 2021, before numbers and rates increased in the following two years. Leaving aside the likely revision of the figure for 2024, looking for evidence of impact of any policy and practice changes on the number and rate of children going into care over this turbulent period becomes particularly challenging.
It’s worth looking beneath the overall headline to consider the age groups of children coming into care, where the story (or stories) becomes much more complicated.
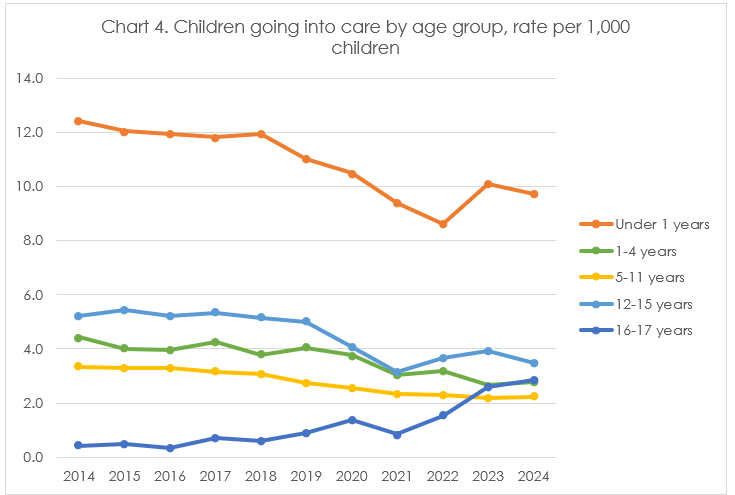
Using population rates to account for demographic change over the period, Chart 4 shows change over time in the number of children from different age groups entering care. Here we can see a largely downward trend for all age groups across the whole period apart from for 16-17 year-olds, where the gradual increase up to 2019 accelerated after a dip in 2020. Children in care are sometimes talked about as if they are a homogenous group, but of course they are not. To truly understand the experiences of children in care, it is essential to identify and consider the circumstances of different children being cared for in the care system, particularly as changes to policy and practice may affect some and not others. At the very basic level, we know that the circumstances and needs of babies and infants who need care because of protection concerns are very different to those of older children coming into care, which could be, for example, through seeking asylum or because of offending behaviour.
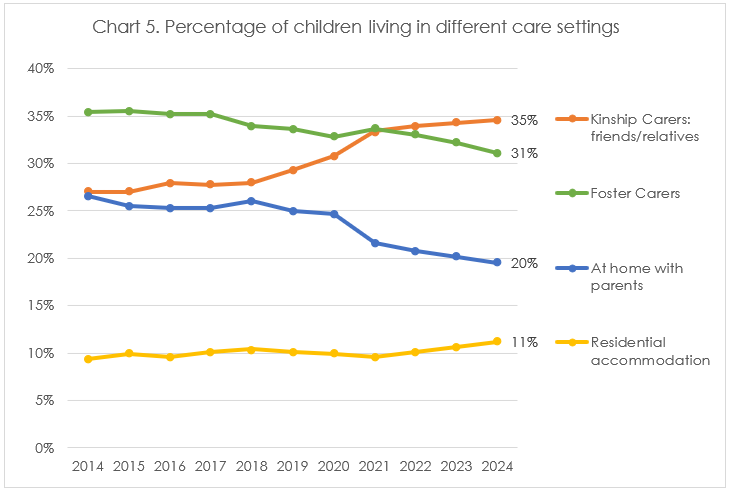
When we look at what children, young people and their families need, data on where children are living and the type of care being provided, and how this may or may not relate to outcomes, is something that policy and decision-makers, leaders and researchers have come to rely on. This is especially important when working towards the aspiration of seeing a higher proportion of children being able to remain living with parents or in family settings. Indeed, the Promise Progress Framework includes indicators monitoring the number and proportion of children in care living with their parents, with kinship carers and with foster carers against those living in non-family residential settings. On the surface, monitoring the relative proportions of children in care in family and non-family settings seems sensible, but the emphasis on proportions is problematic.
To explain further, the number of children living in residential settings has been remarkably stable in recent years (around or just below 1,500 children), but as there has been a reduction over time in the number of children living in family settings, the proportion (percentage) of children living in residential settings inevitably increases as one number falls and the other stays the same. This can be seen in Chart 5, where the percentage of children living in residential settings has increased although the numbers have not. While it is possible that residential settings might not be the most appropriate place of care for some of the children living there because family settings were not available for them, residential settings can be the most appropriate place of care for some children, such as children with complex support needs. The residential settings category includes residential schools and secure care. We must not lose sight of the aim to have every child in care being cared for in the most appropriate setting that meets their needs.
The final point is to note the substantial variation across local authority areas that can be masked when only the national data is considered.
A common concern across public services more generally is a ‘postcode lottery’ of provision. Data is a useful tool in understanding what is happening where. Sometimes this reflects the appropriate and dynamic response to specific needs and populations. At other times, it can signal the impact of planning services or resource constraints.
To illustrate this, Chart 6 shows the variation in the percentage of children living with kinship carers in 2024, and this ranges from 59% down to 16% for mainland authorities, with two of the island authorities having even lower percentages.
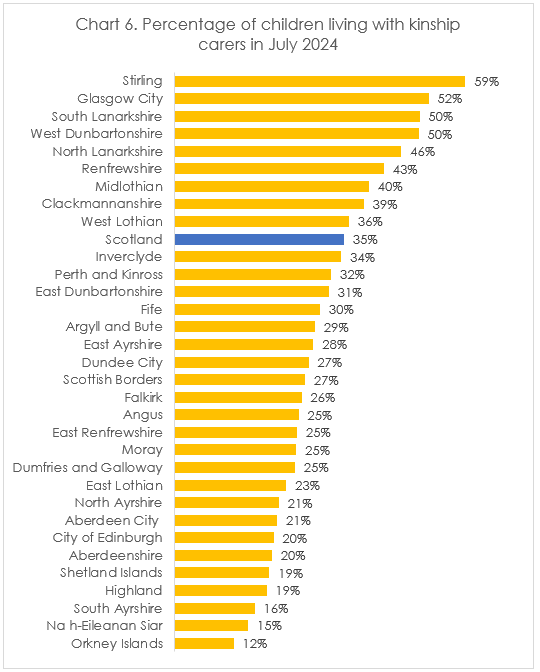
The difference between Scotland’s two largest city local authorities (Glasgow with 52% and City of Edinburgh with 20%) immediately leads us to question whether there are differences in policy and practice that would explain this and what these might be.
What we see in the data is that national data tells us part of multiple different stories, and that a simple focus on overall headlines risks ignoring the important complexity beneath. For me, the data always raises as many questions as it answers, and it is clear that collection and use of data at a local level is critical to understand local developments, and the extent to which local change to policy and practice could be behind this. Even if changes to policy and practice were introduced uniformly across Scotland, it would take some time for the effects of local activity to percolate through to the national data. When change is introduced sporadically to systems that are already disparate, it becomes much more difficult to see evidence of impact of this change at national level, and that’s leaving aside other factors that will also affect the number of children requiring and receiving care and protection through the care system.
As Claire Stuart, Head of Insights at The Promise Scotland, cautioned in her recent blog anticipating release of these latest statistics, the numbers can only tell us part of the story of change. Inevitably, the latest numbers relating to indicators included in the Framework will be scrutinised to determine if change can be observed, but we shouldn’t jump to conclusions based on limited evidence.
Moreover, alongside quantitative data and indicators, we must collect and identify qualitative information about the experiences of children, young people, and families to ensure that Scotland is more meaningfully able respond to their needs. Together as we continue to develop national data collection the focus must remain on ensuring we understand the different journeys and experiences in our care system. We all have a responsibility and opportunity to contribute to this development of further contextual information to supplement and flesh out outline data to tell us more about the story of progress in Scotland and measure what actions, policies and investment can contribute to improving support.
The views expressed in this blog post are those of the author and may not represent the views or opinions of our funders.
Commenting on the blog posts: sharing comments and perspectives prompted by the posts on this blog are welcome.
CELCIS operates a moderation process so your comment will not go live straight away.